Tag Archives: analytics

Cure Analysis Paralysis with this Visual

In this wonderful era of exciting, off-the-shelf prospect research tools and one-click-away data analysis, how is it that we still struggle to prioritize our donors and prospects? But we do. The results come in, the scores are assigned and yet there are still way more highly-rated prospects than our staff could possibly contact. Which names do we call on first?

Human brains are not wired to interpret and act upon long lists of names with appended information, such as those found in our databases and Excel spreadsheets. And when you need 50 names, but there are 300 that all have the same top score, it can be paralyzing!

Whenever I hear about data visualizations I always see pictures of charts and graphs in my mind’s eye. But when I was grappling with how to deliver a prioritized prospect list to a client recently I decided against charts and graphs. I wanted something that would give them a colorful visual with graphics, but also actual donor prospect names with dollar signs.

The organization had decided to create a more formal corporate giving program. It had been happening accidentally and now they wanted to get serious. So she sent me a list of over a thousand of their best donors based on giving history. My job was to sort it out and send it back.

We decided to focus on two variables that we labeled engagement and gift potential. Engagement was based on RFM scoring, which stands for recency, frequency, and monetary and represents a giving history analysis. We also appended some estimated sales and other data to determine gift potential.

As you can see from the picture below, the key to the data visualization was limiting the presentation two only two, easily understood and highly relevant variables. (The information in the grid is fictional.)

Click to enlarge

Following is how you “read” the picture for this donor list:

  • Stars = high engagement, high gift potential
  • Loyal = high engagement, low gift potential
  • Opportunities = low engagement, high gift potential
  • Likes = low engagement, low gift potential

I knew that my client, a talented fundraising professional, really wanted to begin her efforts with a fighting chance of receiving major gifts in the first year. Who wouldn’t want that? It was up to me as a researcher to understand how to translate the organization’s fundraising program intentions into data points, create or get those data points, and then translate it back into fundraising actions.

My client didn’t need to understand exactly how I sorted and filtered to assign donor prospects into each of these categories. She needed to be able to recognize some names, be pleased and surprised to see some names she didn’t recognize, and be able to quickly make decisions about which ones she will call tomorrow.

No matter what kind of fundraising professional you are – front-line, prospect research, or something in between – you now have a simple way to visualize two variables that you can ask for or apply to the data yourself.

If you have a data visualization triumph I’d love to hear about it! Reply to this email or better yet, comment on the blog post.

More Resources

To Advocate or Not to Advocate – there is no question!

advocate
“Advocate” by Nick Youngson, is licensed under Creative Commons 3 – CC BY-SA 3.0

Something big and very exciting is happening in the field of prospect research. It is at once both thrilling and terrifying, but then again, the best things in life usually are! Do you know what I am talking about? Prospect research has become the center of attention concerning the use and abuse of data in nonprofit fundraising.

The Thrilling Aspect

For years prospect research languished in basements, yearning for that exclusive seat at the leadership table. Thrillingly, prospect research professionals in the U.K. have been thrust into that seat with all the anticipation of slowly ratcheting up the roller-coaster-mountain and the subsequent terror of being dropped with a 5.5 G-force speed down the other side.
It’s official. Data is a big deal. And the guardians and operators of data in non-governmental organizations (NGOs) are prospect research professionals.
So after working long and hard behind the scenes, after advocating to fundraising leadership for the use and respect of prospect research, we have arrived at the leadership table. And my, what an entrance we have made!

The Terrifying Aspect

In the U.K., the Information Commissioner’s Office (ICO) has been fining charities for violations of the Data Protection Act 1998. The fines have ranged from a low of £9,000 to a high of £25,000. The IOC has done a lot of interpretation of the Data Protection Act 1998, and has surprisingly used emotional language.
The fines include best practices in prospect research such as the following:
Is this the end of prospect research in the U.K.? I doubt it. There will be changes as NGOs adapt their data and privacy policies to carefully reflect their fundraising practices. Some NGOs will even seize this as an opportunity to share their fundraising “data story” with the public.

New Perspective Fueled by Advocacy

After this terrifying plunge, the interpretation of the Data Protection Act 1998 by the ICO may shift as NGOs, fundraisers, prospect researchers, donors, and other constituents react and lend their voices to the conversation. For example, the Institute of Fundraising issued a report, Good Asking, exploring why charities research and process supporter information.
 .
On the other side of the Atlantic Ocean, instead of a tightening of data privacy, the U.S. has been experiencing a loosening of data privacy. On April 3, 2017, President Trump repealed a set of privacy regulations requiring “internet service providers to request authorization before selling sensitive customer data to advertisers, or using that same information for marketing campaigns.” (Click for article)

What Can You Do? Advocate!

Whether you are in the U.K., the U.S., or any other country, we prospect research professionals are most often the guardians and operators of fundraising data in our organizations. We may have little or no leadership authority (yet), but that doesn’t mean we can’t advocate for our profession and for solid data practices – before we find ourselves the subject of unflattering news headlines.
It’s easy to say we should advocate, but what might that look like in real life? Following are three steps to help you advocate effectively:
  1. Define the change you desire. Just as in goal setting, clearly defining the change you want to effect is important. Are you advocating for the creation of a data privacy policy, or are you advocating for your prospect research position or department?
  2. Determine your strategy. Strategy comes before tactics. Who needs to be persuaded to make change happen? Where are the obstacles to the change you seek?
  3. Craft your tactics. Tactics are the kinds of actions you take to fulfill your strategy and effect change.
Consider the story of Suzanne Harris at the Philadelphia Museum of Art. It is a classic case of advocacy gone right! Suzanne wanted to introduce RFM scoring. She talked up RFM scoring and quoted gurus in the field. She built a relationship with IT to create an automated score that could be refreshed. Then the Development Department threw a party for all staff, on a day fundraisers were likely to be in the office, and used games to educate and demonstrate the value of the new scores.
Advocacy isn’t just for associations or organizations with a cause. It’s something all of us do all the time. We advocate for a raise, to have dinner at a certain restaurant, or to visit somewhere special for vacation. Advocacy becomes more complex when there are more players and procedures in between the current status and the change we desire.
 .
Considering the level of strategic complexity we navigate when we provide insights in prospect profiles, analyze prospect portfolios, and perform data mining, we can handle advocacy!

More Resources You Might Like

Warning! Anyone can do analytics.

colorful
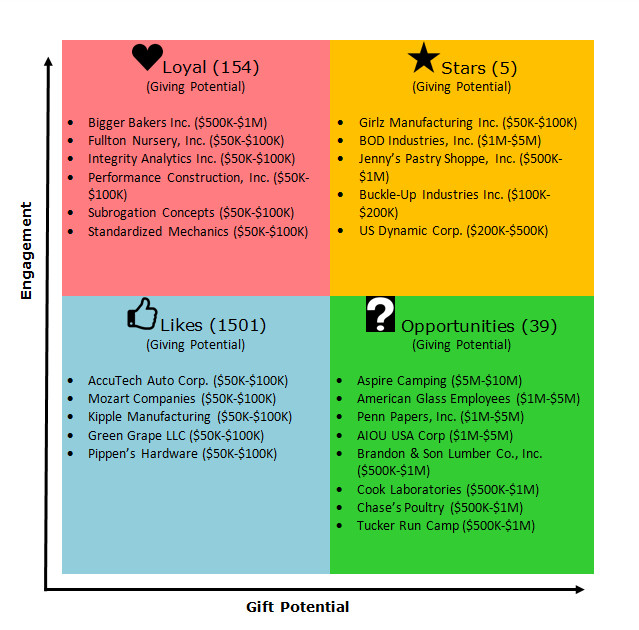
Two of the strongest characteristics prospect research professionals have in common is insatiable curiosity combined with a surprising boldness. We are proudly generalists! And very good at it too.

I was inspired by a visit to the Philadelphia Museum of Art in September where an APRA Pennsylvania member shared how she fearlessly tackled fundraising analytics to upgrade the organization’s major gift prospect pools.

Suzanne Harris is a Research Analyst and her supervisor is Sarah Cadbury, Director of Prospect Research and Management. A new researcher, in 2014 Suzanne was a successful student of the Prospect Research Institute’s inaugural Introduction to Prospect Profiles course. When she joined the Philadelphia Museum of Art she jumped right into a campaign and the prospect identification and tracking that goes along with that.

Sarah had created a campaign rating – the amount a specific prospect was anticipated to give – as a way of sorting and compiling the campaign gift table. They also had external vendor ratings, including a capacity rating from 2014. As discussions swirled around segmenting prospects effectively it became clear to Suzanne that a score based on internal data was needed.

At a previous organization Suzanne had read Joshua Birkholz’ book, Fundraising Analytics: Using Data to Guide Strategy, and had become interested in creating an RFM (Recency, Frequency, Monetary) score, but she hadn’t quite figured out how to adapt the book’s method to their constituency.

At the Philadelphia Museum of Art she was using the Raiser’s Edge donor database. Raiser’s Edge provided summary financial data, which was exactly what she needed to calculate RFM.

But still, Suzanne struggled with how to make it come together for the Museum. She began having conversations internally with database/IT folks. She emphasized how the RFM data would be used and why that was important.

She attended an APRA conference where she heard Joshua Birkholz talk about the value of fundraising analytics. Upon returning to the office she read her notes out loud, verbatim, to persuade people of the importance of a score like RFM.

Then, finally, it all came together in one meeting. Suzanne sat down for about an hour and half with an internal database guru and they worked out how the RFM could be automatically calculated using an intermediary Access database. They cherry-picked the data points most relevant to the Museum and created the scores based on them.

Suzanne’s “I can do anything” generalist attitude, combined with her ability to boldly persuade others of the importance of an internal score had resulted in success!

Marcy Serkin, Deputy Director of Development for Development Operations, suggested they roll out the RFM scores with a party. So they did. The party was an inclusive, all-staff party. People who had no idea of what ratings were learned about them. They threw the party on a Monday because the Museum is closed on Mondays and the gift officers are usually in the office.

Much like any other product launch party, they introduced RFM with a theme, fun activities, and education. Inspired by the art of Lisa Frank, they chose a colorful rainbow and unicorn theme.

Data Mining: Because Unicorns Don’t Find Themselves.

They created custom stickers and let people “taste the rainbow” with Skittles candy. They played a game, too, where everyone had cards with RFM scores. The last three people standing – the unicorns in the room – all had high scores and were not assigned to a gift officer. Their prize was a swipe at the unicorn piñata!

Suzanne is not a statistician or a data scientist. She is a prospect research professional. A generalist!

She used her prospect research knowledge to persuade others about the importance of internal scoring and to collaborate with her to create and launch the scoring so that it could have a positive impact on the campaign – and even beyond the campaign to annual fund and planned giving.

Suzanne is a prospect research hero! You can be, too. Be confident in your skills and boldly persuade others to use research effectively for fundraising.

More Resources You Might Like

excel_tips_favorite_formulas

Join the Resource Collections online community to access this video tutorial.


Score! takes the edge off analytics

I just read Score! cover to cover and here’s why I think you should too…

With Score! Peter Wylie and Kevin MacDonell have written a highly accessible book that works effectively as a beginner’s guide to driving your organization’s decision-making with fundraising analytics. It’s no surprise to those of us in the prospect development field. Peter has been writing entertaining and informative books and articles for years and Kevin’s CoolData blog is encouraging and full of easy-to-understand visuals. Both of them write about personal experiences that nicely demonstrate the ideas and concepts in the book.

This is not a do-it-yourself manual. Peter did that already with his book Data Mining for Fund Raisers. This book is for leadership and for aspiring analysts alike who want a guide to getting something great to happen. No-one feels like a fool for not knowing how analytics works (or even how to define it) and although Peter calls out leadership’s common foibles, an ambitious leader can easily swallow that pill because it helps him navigate past the pitfalls.

The book is conveniently grouped into three sections so you can decide what you want to read. Part one, Becoming a Data-Driven Organization, discusses how analytics can help you make decisions that lead to success. Part two, Your Data Driven Job, discusses what it’s like to pursue analytics in your prospect development career. Part three is devoted to case studies.

Part one launches with scenarios that are happening in advancement offices every day, but when highlighted in a short paragraph make one blush with embarrassment. You also get great information on obstacles you are likely to encounter as you seek to invest in analytics and a helpful discussion about whether to hire someone new or train an existing employee.

One of the salient points made in the book from start to finish is that fundraising analytics is all about valuing affinity – the relationship someone has with your organization. Wealth ratings and other external data is nice, but only works really well when paired with affinity. The wealth screening companies have drowned the marketplace with sales, advertising, and educational content that does not shine such a bright spotlight on using analytics to find and leverage the conversation your prospects and donors are having with your organization as recorded in your databases. Score! gets you back on track.

If you are facing the challenge of clueless leadership that does not value data, then this first section falls a bit short. Given Peter’s years of consulting I was hoping for a few guerrilla tactics and approaches to persuading leadership that analytics is the new, shiny object every leader has to use. Instead the authors give us brief vignettes of some of the good stories where leaders model the kind of behavior that encourages analytics efforts to succeed.

Part two is where the aspiring analyst gets some very thoughtful and perceptive advice about the skills needed to take on these kinds of tasks. By including a chapter on soft skills, and putting it first, there is a clear message. You can be awesome at analyzing data, but unless you can translate your results into information others can use and understand, you are not likely to achieve success. Kevin’s CoolData blog is a living example of good and useful presentation. As a bonus, Kevin and Peter share their personal stories on how they came to analyze nonprofit data for a living.

Part two also has some gems that surprised me and made me think more deeply. Although I have been using the term fundraising analytics as an umbrella term here, Kevin and Peter give you an education about the difference between data mining and analytics. You also get some terms and techniques defined – a few fundamentals. But don’t worry! The authors walk you through some step-by-step starter tasks. The highlighted quote is just one of many that should assure you that you won’t break anything by trying.

“Don’t let missing, incomplete, or suspect data stop you from jumping right in and trying to work with it just as it is.” (p.91)

Part three is a series of case studies. As the authors emphasize, these are not do-it-yourself instructions. They are case studies that illustrate the types of questions you might ask your data and some answers others have found. Kevin and Peter do a great job here of outlining the steps they took and then going into detail about what happened as a result. These case studies will give you big picture ideas to guide you as you craft your own projects. They are helpful to leadership too because they demonstrate winning applications.

In particular I was intrigued by the call center data case studies. And, of course, just a few days after reading the book a fundraising colleague described to me how she does not give to her alma mater and will not give to them, yet they have been calling, emailing and writing her repeatedly each year. She just rolls her eyes.

A huge shift is just beginning to happen as younger generations earn and accumulate income and wealth in an era of rapid changes in information technology that is creating new and changing expectations for communicating. The popular LifeHacker blog wrote a recent post with this title: How Can I Donate to Charity Without Getting Harrassed By Them Later?

It will be those organizations that listen to the conversations in their data and respond to them that will win those donors’ trust…and dollars. Score! is written about analytics in higher education, but the lessons apply equally to human services organizations. Don’t miss out. Buy, read and Score!

Don’t believe me? Read what Susan Bridgers of APRA Carolinas has to say about it!

Want to catch up on the most current buzz? Search the Twitter hashtag: #scorethebook

Data Mining Resources

I was poking around to see what I might find on the internet and thought I would share my favorite finds related to data mining. I hope you enjoy them too!

Five ways to promote in-house data mining
by Kevin MacDonell

5 reasons every nonprofit should use analytics for fundraising
by Joshua Birkholz

From Stories to Evidence: How Mining Data Can Promote Innovation in the Nonprofit Sector
by Technology Innovation Management Review

Fundraising Analytics ABCs
by Helen Brown

The Do’s and Don’ts of Data Mining in Nonprofit Fundraising
by Daniel Neel

Getting Started in Data Mining (It's easier than you think!)

I have had a few requests for articles on simple data mining techniques and the related database maintenance necessary to make the results meaningful. Look for my upcoming companion blog post on data mining resources, too.

Before we get started, let’s talk a little bit about what might be holding us back.

  • Fear that it’s too complicated – Not much anyone can do about this one, except you. Jump in! The water is warm!
  • Assumptions that leadership will not invest and support it – Data mining and analytics are keyword candy to leadership. Leadership loves to get intelligent answers to questions like “What percent of donors rated at $100K+ gave at that level?”
  • No clear understanding of the pain/need/goal – What keeps your leadership awake at night? Is it prospect pools that don’t perform? Finding leadership donors for the upcoming campaign? If you don’t know, you can’t make a compelling case for data mining.

Donor Database Reports

Do you remember that scene in the Sound of Music where Maria is trying to teach the von Trapp children to sing? She stops singing “Do-Re-Mi” and says, “Oh, let’s see if I can make it easier”. We can do that in data mining too. (I haven’t come up with a song yet, but I’m working on it.) Here is an easy and fun way to get started in data mining – explore all the canned reports in your donor database. I’m not kidding! Even if you have no idea what deep, insightful questions you want to answer, you can begin with reports.

Consider these common reports:

  • Consecutive years giving – When donors give many years, especially consecutively, it usually means they really like us. Who are these people? Do they have high wealth ratings? Could they be good planned gift prospects?
  • Top donors – Are all of your top-giving donors getting regular attention?
  • LYBUNT, SYBUNT, & new donors – Within these reports you might find donors capable of increasing their gift, some major gift sleepers, and some new donors with wealth.
  • Lifetime giving and number of years giving – So many forgotten donors can be found in this list as well as some very good planned gift prospects.

Digging a Little Deeper

MS Excel is on most of your desktops. If you take a little time to learn to use it – I’m not talking complicated formulas, just tips and tricks – it will truly open the world of data mining to you. Imagine that you pull a report into Excel with all of the key fields in the above reports (last gift date and amount, largest gift date and amount, lifetime giving, etc.). Add in wealth ratings if you have them.

Now consider this scenario:

Custom sort:  First by largest gift amount (descending), second by lifetime giving (descending), third by last gift date (descending)

Analysis:  By scrolling down the list you can see if any donors who have made larger gifts (largest gift amount) and have lapsed (last gift date). Is there some high lifetime giving low on the list? Why?

Imagine sorting first by wealth rating and then largest gift. How about lifetime giving and wealth rating? This is fun! (I told you the water was warm.) Just be sure to watch your time. Prospect researchers have gotten lost in the data mining game.

The Secret Data Mining Trick

The secret trick to analyzing your donor information is to understand your fundraising fundamentals. Remember the fundraising pyramid?

The pyramid illustrates your areas of opportunity:

  • Occasional: Did that first-time $1,000 donor get personal attention?
  • Annual: Are there small annual gift planned giving prospects in there?
  • Annual: Can we motivate annual donors to move up a giving level?
  • Major: Do any of your major gift donors have unexplored planned gift potential?
  • Planned: Are there any planned gift donors who could make a cash gift?

Common Data Errors that Under-Mine Your Efforts (pun intended)

Now that you have the idea that you can sort on specific fields in your donor database, you will very soon realize that even sorting becomes problematic if the data is full of errors and omissions. Use your blossoming interest in data mining to clean up the database! Then when you are ready for more complicated data mining challenges, your data will be ready for you.

  • Data errors in any of the fields you pull – e.g., incorrect or missing dates or dollar values
  • Duplicate records – often happens in gift entry or multiple hands in the database
  • Deceased or bad address – if you don’t mail to your list, you probably aren’t getting your list cleaned; if you are mailing, you might not be getting a file back from the printer to update the records

What can you do about problems like these? People don’t usually like to hear this, but you need some documentation.

  • Your database probably has some maintenance reports. Set up a schedule to run them and fix the errors.
  • Do you need to run a report of all changed records daily or weekly?
  • Gift entry staff should be trained to search for the donor name first, instead of entering a new record. As in, create your own training manual for how gift entry is performed in your organization.
  • Someone should review all gifts entered, probably daily.

Robert Weiner is a consultant with some excellent free articles about keeping your database up to snuff. You can find his articles here: http://www.rlweiner.com/articles

Taking Data Mining to the Next Level

Once you have your data in order, some understanding about how the information is stored, how you can retrieve it, and what kinds of things it can tell you about your donors and prospects, I suspect you will be a lot more likely to sign up for that data mining webinar or take advantage of the APRA Analytics Symposium. It feels good to be ready, doesn’t it?

Making Analytics Accessible to All

In “Geek Philanthropy: Data Huggers”, the Economist (10/20/2012) tells the story of DataKind, an organization dedicated to using data analytics to help nonprofits. As the Economist points out, businesses are actively using advanced analytics to improve their efficiency. Nonprofit organizations have lots of data too, but usually not so much money. Could the benefits of data analysis – improved program and fundraising outcomes – be within your organization’s reach?

According to their website, DataKind organizes three distinct efforts to share analytics with nonprofits:

  • DataDive™ – a weekend event that teams three selected social organizations that have well-defined data problems with volunteer data scientists to tackle their data challenges. These events are completely free and voluntary and serve to energize the base, provide direct services to organizations, and to enlighten social sector groups to the power of using data in their programs.
  • DataCorps™ – a select group of data scientists who work on volunteer or contract data projects part-time. These members work for one to six months on targeted data projects that they flesh out with the organizations that apply. Our volunteers are paid by the organization or are housed within private companies who take on the projects (e.g. Google gives 20% time to three scientists for a month to execute a project).
  • In-House Data Staff – We maintain a full-time staff of data scientists that take on the most pressing and high-impact problems for a variable length of time. These full-time employees are paid directly for their services by the organizations involved.

The Economist described a DataDive, affectionately called a “hackathon”, in San Francisco. DataKind volunteers analyzed the data from Mobilising Health, a non-profit group that connects rural patients in India with doctors in far-away cities via cell phone. Among other things, DataKind helped Mobilising Health to take more account of urgency and to direct requests to the most responsive doctors.

Improving efficiencies and outcomes of an organization’s programs using a dataset like the cell phone records and text messages was great for all involved. The organization received the results, plus the ability to better track and respond to information going forward. The data scientists worked on a project that challenged their skills and taught them new skills.

We might call Mobilising Health a very “ripe” subject for data analysis. They had an organized, well recorded set of data. Thank you cell phone companies! But what about organizations that are offering after school programs or programs at domestic abuse shelters? And what about fundraising operations?

Notice that the only free service DataKind offers is the hackathon weekend for “well-defined data problems” such as Mobilising Health. What do we know about the majority of nonprofit organizations? If the information is even recorded, the data is often “dirty” and leadership unaware of what types of problems data analysis can help them solve. The potential for improved mission performance through data analysis is exciting and very, very real! But so is the underwhelming enthusiasm for data collection and maintenance.

Not all of us are born as philanthropy geeks and for many people, the care and maintenance of data is about as thrilling as watching grass grow. But understanding the value and potential of data collection – significantly improved mission outcomes – is pretty glamorous.

When it comes to fundraising, Joshua Birkholz wrote a very friendly read – Fundraising Analytics – for the Wiley/AFP Fund Development Series. The most important part of the book is the beginning where he talks about translating your fundraising goals into questions that can be answered with data. Once you understand what it is you want to know, recording, maintaining and analyzing the data can be done by others. Maybe even a DataKind hackathon crew!

Prospect research professionals are your neighborhood philanthropy geeks. We help you translate your goals into questions and translate your questions in data recording and reporting. The ability to monitor your fundraising performance and react to external and internal donor trends can lead to impressive dollars raised – and transform your ability to perform your mission.

Have you worked with a friendly neighborhood philanthropy geek today?

About the Author

Jen Filla is president of Aspire Research Group LLC where she works with organizations worried about finding their next big donor, concerned about what size gift to ask for, or frustrated that they aren’t meeting their major gift goals.

Other Articles You Might Like

The Future of Donors in Your Data

CoolData Blog by Kevin MacDonell

5 ways to Use Donor Ratings

The Future of Donors in Your Data

From Pushing information to Partnering to Creating Conversations, prospect research has come a long way to uncover donors in your data.

Before the internet and before relational databases, the world had a different perspective on information. Gathering information, analyzing it and producing a thoughtful presentation that pulled all of the pieces together looked like books, white papers and other time-consuming and laborious efforts. Post internet and relational databases, it can still look like that. But now those books and white papers have a whole lot of other company in the form of shorter and/or more precise groupings of information, and often leave us, the users, to draw our own conclusions.

Pushing Information

Before the world went digital, prospect research required visits to the library, combing through paper files and interviewing people in the organization. After this manual collection, the information was compiled into a profile. You might have gotten suggestions on how to cultivate and what gift to ask for from the prospect, and you might not have. Browsing newspapers and magazines for who’s who in the community was dominated by the front-line fundraisers.

Now, the internet supplies us with extraordinary access to information in our town, state, country and in the world. With some prospects, the challenge is not finding information, but whittling down the information to what is most relevant and useful for fundraising. Relational databases give us the ability to store multiple levels of connecting information, such as all gifts made to a fund over a period of time or one individual’s gifts to a fund over a period of time. We can ask questions that our database can answer quickly and easily. Because of this, prospect researchers have moved out of the library and onto the computer.

Becoming Strategic Partners

For many researchers, we have stopped pushing information and have begun partnering with our front-line fundraisers. We don’t create the same prospect profile for every request. We customize our research to answer the most common and most pressing questions. More and more we are being brought to places like the campaign planning table, where we present information about our donors to assist leadership in making decisions. Questions answered might include, “Do we have enough prospects with the capacity and affinity to make the leadership gifts we need to launch the campaign?” or “How many of our annual fund donors made their usual operating gift plus a gift to a special project when asked?”

Prospect research has been providing reactive research such as profiles and proactive research such as filling prospect pipelines and maintaining relationship management systems. In many organizations, especially higher education and large hospitals, prospect research has become a strategic partner on the fundraising team. Prospect research ensures that front-line fundraisers have the prospects to visit and the information intelligence to solicit the largest and most appropriate gift.

The Explosion of Big Data

When you combine the storage and retrieval advances of relational databases with the internet, especially social platforms, you have an explosion of information – most often referred to as “big data”. Most people are aware of the results of harnessing the power of this much data, but few understand how it works and are capable of applying it to new situations. Results look like Amazon.com offering you suggestions on what others purchased with that book you were browsing or other popular titles in that section. It also looks like Google’s Flu Trends that helps specific hospitals predict patient volume during the flu season.

Creating Conversations With Data Analytics

The future of prospect research is already here. Right now, organizations across the country are using new tools to answer complex questions and track complex trends. These new tools are visual and manage multiple file formats with the same ease with which Superman leaps tall buildings in a single bound. Your database might be clunky and difficult to get information out of, but as long as the data is consistent, these new tools make analysis and reporting pretty simple. Often using an online “community” setting, prospect researchers create projects and share them with other fundraising staff. In some cases, with a little training, those front-line fundraisers and other staff can tweak the results on their own.

For example, using intuitive drag-and-drop technology, a prospect researcher can view information from the donor database from multiple perspectives. Let’s say the business school wants to send invitations to exclusive events around the country to raise funds for a new program. Our researcher might start with a quest to find business school alumni, within a certain graduating year span, who were members of a particular school club. She uploads that file to the project area. Next, she calls the business school fundraiser. On the call, the researcher and fundraiser discuss the project they can both view live on their desktops. They begin to “play” with the uploaded list.

  • Can you show me who made gifts at $1,000+?
  • Now who lives within 50 miles of the first location?
  • Hmmm. Too small.
  • Okay. What do the people who live within 50 miles look like? Wait! We limited the graduation years. Can we include all graduation years?
  • Another file is uploaded to the project space with much broader information this time.
  • What do the people who live within 50 miles look like? Gift size, graduation year, club participation, frequency of giving and whether they are assigned to a gift officer.
  • The researcher creates a bar chart of giving frequency because she thinks there might be a pattern.
  • Wow! It looks like club participants are frequent givers. What if we look at all frequent givers whose past 5-year total is over $5,000?
  • The researcher clicks on the bar in the bar chart of most frequent givers and “pulls” it out. She then applies a filter for past 5-year total giving.
  • Okay. That’s still too many. How many live within 50 miles?
  • The researcher clicks on the new list and applies another filter.
  • But I can’t invite anyone who is already assigned to a major gift solicitor.
  • Another filter is applied.
  • That’s a good number of people!
  • The researcher saves that “report” so the fundraiser can pull it for the mailing and RSVP list. The unique constituent number is attached so that the invitation mailing and other activities can be recorded in the donor database.
  • After the event, a new file is pulled into the project space so that the effort can be evaluated using the same techniques.

This was a simple example, but notice how the researcher was beginning to create conversations around the data? She could recognize certain trends and demonstrate them visually to the front-line fundraiser.

Do You Have Enough Data for Analytics?

If you think that you don’t have enough “big data” for projects like this, I suggest you think it over. Most organizations collect more data than they view or use in any meaningful way. We have Facebook friends, Twitter followers and email campaigns. We have the data, but it’s like the junk drawer in your kitchen. It’s all a jumble and finding anything specific takes too much time. For example, lots of organizations of all sizes are still struggling with email campaigns. New email donors receive snail mail instead of email, or nothing at all. Especially for emerging organizations, all of these separate fundraising and stewardship/marketing efforts are often collecting data separately and they may or may not be able to access that data in any meaningful way.

But if we could throw our jumble of data files into a “project”… we might learn thing like we have (a) donors who (b) like us on Facebook, (c) click on our videos more than other posts and (d) make higher online gifts than other online donors. That would be useful information, right? You might then want to learn which video topics generate a better response than other video topics. If you had no idea this was going on, you would continue to randomly post videos on whatever content, and maybe even platform, that felt good at the moment. Combining donor data with Facebook data yielded new insights that could change behavior leading to higher giving with less effort.

Is Analytics Really Out of Reach?

Even if you feel that these “sophisticated” techniques are out of your reach, either because of staff skill level or cost, I urge you to take a larger look at your fundraising program – just to be sure. Many of us lament that leadership does not see the value in investing in fundraising staff or donor acquisition. We wish they could go beyond counting existing dollars to see the magic of investing in a staff member who raises far more funds than her salary. I am inviting you to step out of your technology “counting” and see the magic of streamlining your fundraising efforts through the efficient use of data.

I’m not suggesting that you jump into “big data” collection and analysis – unless you really see value there. I’m suggesting that you consider how a combination of outsourcing and internal skill-building could lead to consistently improved results. What if you could…

  • Put in place a routine appeal evaluation (snail mail, email, or social media) that showed you in numbers, and visually, how you performed this time and compared to other efforts.
  • Know how much you could spend on donor acquisition and still make a great return on your investment based on knowledge of existing donors?
  • Tightly track the behaviors that lead to consistent major gifts – whether that’s multi-year pledges to special projects or high-end yearly gifts?

And those examples don’t even touch social media, website performance or whether your stewardship program actually leads to loyal, increased giving.

You are Never Too Small, Too New, Too Anything, for Good Strategy

When you hire a prospect researcher, as a consultant or staff member, you can hire and train a strategic thinker who will help you streamline your fundraising, raising more money with lower costs. Prospect research has something of benefit for all organizations. Whether or not you join it, prospect research’s path in fundraising continues to move forward into new territory, leaving behind it a clear and certain trail of fundraising success!

Other Posts You Might Like

Millionaires Use Social Media

The Multi-Channel Fundraising Game

Facial Recognition Software and Donors

About Aspire Research Group LLC

Headquartered in Tampa Bay, Florida, Aspire Research Group was founded so that every development office could have the benefits of professional prospect research. Known for our creativity and clear communications, we work with organizations who are worried about finding their next big donor, concerned about what size gift to ask for, and frustrated that they aren’t meeting their major gift goals. Do you need to close more major gifts?

www.AspireResearchGroup.com 727 231 0516